Sign in to Google Analytics
- Go to analytics.google.com.
- Sign in with your Berkeley Lab account.
- After signing in, take a moment to familiarize yourself with the Analytics interface.

An overview of the main Google Analytics interface.
- Switch between accounts and properties: In the top-left corner of the Analytics interface is a menu you can use to switch between all of the Analytics accounts and properties for which you have permission.
- Search box: Search for instant answers to your questions, reports, admin pages, insights, manage accounts and properties, and access help content.
- Get help
- When you click the ? icon to get help, you can read a brief article about the current page, or select More help resources to find popular articles, search the Analytics Help Center, and access the Google Analytics community.
- Click the vertical dot More icon to start a guided tour of the Analytics interface or send feedback to the Google team.
- Navigation pane: Use the navigation pane on the left to access reports, advanced explorations, and administrative features.
- Home: Find information that's relevant to you based on your behavior in Analytics.
- Reports: Monitor traffic, investigate data, and understand your users and their activity.
- Explore: Explore your data with a collection of advanced techniques that go beyond standard reports to help you uncover deeper insights about user behavior.
- Admin: Access Analytics administrative features, including creating new accounts and properties, and managing users.
Create an account
To begin using Analytics, you must first set up a new account. If your organization already has an account, you may:
- Skip to Create a property to organize a new property under an existing account
or - Continue to the next steps below if you want to create another account for a website.
Refer to Organization for more information about organizing accounts and properties. You can have up to a maximum of 100 accounts.
- Go to https://analytics.google.com.
- In Admin, click Create, then select Account.
- Provide an account name. Configure the data-sharing settings to control what data you share with Google.
- Click Next to add the first property to the account.
Create a property
You need the Editor role to add properties to a Google Analytics account. If you created this account, you automatically have the Editor role. You can add up to 2,000 properties to an Analytics account.
- Are you continuing from Create an account above? If so, skip to Step 2. Otherwise, in Admin, click Create, then select Property.
- Enter a name for the property. This can be changed at a later point but IT recommends using the name of your website or the URL so it’s easy to recognize, e.g., IT Division or it.lbl.gov.
- Select the reporting time zone and currency. If a visitor comes to your website on a Tuesday in their time zone, but it's Monday in your time zone, the visit is recorded as having occurred on Monday.
- Click Next. Select your industry category and business size.
- Click Next. Select your Analytics business objectives. Google Analytics tailors the initial default collection of reports based on the information you provide. Editors and Administrators can customize report navigation and further refine collections at any point. If you’re not sure, we recommend selecting Get baseline reports.
- Click Create and (if you are setting up a new account) accept the Analytics Terms of Service and the Data Processing Amendment.
- Continue to Add a data stream to start collecting data.
Add a data stream
Data streams are the pathway to connect your website to Google Analytics. Each Analytics property can have up to 50 data streams.
- Are you continuing from Create a property above? If so, skip to Step 2. Otherwise, in Admin, under Data collection and modification, click Data Streams, then select Add stream.
- Click Web to add Analytics to a website. See additional instructions for iOS or Android apps.
- Enter the URL and Stream name of your primary website, e.g., it.lbl.gov and IT Division.
- You have the option to enable or disable enhanced measurement. Enhanced measurement automatically collects page views and other interactive events such as scrolling, outbound clicks, file downloads, and more.
- Once the data stream has been created, you can always go back and individually disable the enhanced measurement events you don’t want to collect.
- Review the Data Privacy section of this guide for more information.
- Click Create stream.
Set up data collection
Adding a data stream automatically generates an Analytics Google tag measurement ID and associated code snippet. Websites and apps require installation of the Google tag ID or code snippet in order to collect data and send a flow of information to Analytics. This data serves as the foundation for reports.
Note: Experienced users may instead elect to utilize Google Tag Manager to organize and install Google tags.
- Locate the Google tag ID or code snippet
Are you continuing from Add a data stream above? If so, you will be automatically directed to the Web stream details and Installation instructions panels which include the Google tag measurement ID (the format will be G-XXXXXXXXX) and the code snippet. In the Install manually tab, the full code snippet begins with “<!-- Global tag (gtag.js) -->" and ends with “</script>”. - Otherwise, in Admin, under Data collection and modification, click Data Streams, then select the data stream to view the Web stream details. Click on View tag instructions at the bottom of the panel then the Install manually tab to find the code snippet.

The Web stream details panel shows the Google tag ID and installation instructions needed to connect your website to Analytics. - Add the Google tag ID or code snippet to your website. Instructions for common Berkeley Lab websites are provided below. For other web pages and content managers, refer to official documentation.
- Google Sites
You need editor access to a Google Site in order to add Analytics.- Click the gear settings icon then select Analytics.
- Paste the Google tag measurement ID from Step 1 above.
- Make sure to click Publish to complete the update to your Google Site.

Google Sites integrates Analytics in Settings so you only need to add the Google tag ID.
- Wordpress
Many Wordpress themes include a built-in method for adding custom header and footer scripts. If you’re not sure, check the documentation for your theme. If you don’t know what theme you’re using, check with your web manager or the developer who helped set up the site. Depending on your site theme and setup, it’s likely that administrator or editor access to the Wordpress site is required in order to add custom scripts.- Log in to the administration dashboard of your Wordpress site.
- From the dashboard, navigate to the appropriate area to add custom header/footer scripts. If your theme doesn’t include this feature, support from an experienced web admin or developer may be needed to modify the theme.
- For many sites at the Lab using a Wordpress theme set up by IT, you can go to Appearance > Customize from the dashboard. On the next screen, select Theme Settings then Header/Footer Scripts. Paste the full Google tag code snippet in the header section.

An example of a Wordpress panel to add custom header/footer scripts.
- For many sites at the Lab using a Wordpress theme set up by IT, you can go to Appearance > Customize from the dashboard. On the next screen, select Theme Settings then Header/Footer Scripts. Paste the full Google tag code snippet in the header section.
- Berkeley Lab Design System (BLDS)
The Berkeley Lab Design System (BLDS) includes a built-in option to add Google Analytics to a website.- Log in to the administration dashboard of your BLDS site.
- From the dashboard, navigate to LBL Site Settings > General Settings.
- Scroll down to the LBL GTM / GA4 field near the bottom of the page. Paste the Google tag measurement ID from Step 1 above.
- Click the Update button at the top of the page to publish the changes.

Add a Google tag ID to add Analytics to a BLDS site.
- Google Sites
- Confirm that data collection is working. It may take up to 30 minutes for data collection to start and 24 hours for detailed data to appear in Analytics.
- The Realtime report lets you monitor activity on your website as it happens and is the first place to show activity for a newly installed Google tag. To access the Realtime report, click Reports > Realtime in the left navigation pane.
- The Google Tag Assistant is another helpful tool to determine if a Google Tag is correctly installed or if one or more tags are already installed on a site.
Next steps
Now that you’ve completed the steps for getting started with Analytics, you may wish to explore more features and advanced topics which take you beyond the basics. The following next steps are optional.
Understand reports
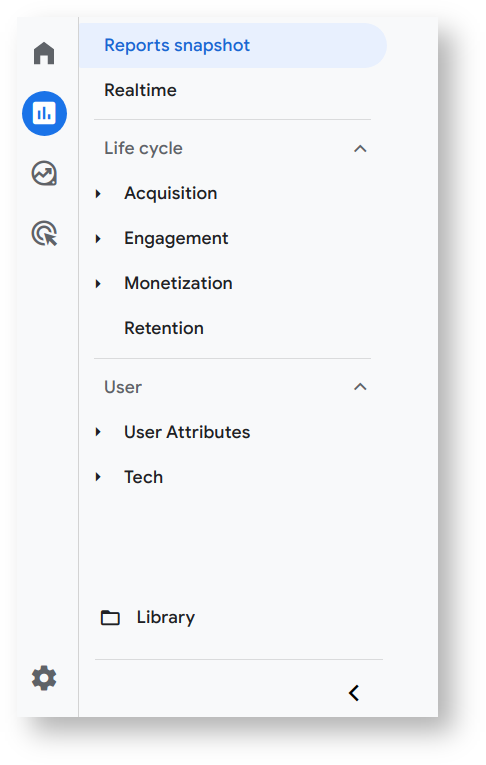
The Reports pane is where you can access all standard Analytics reports.
Google Analytics collects data from your websites and apps to create reports that provide insights into your organization. By assessing reports, you can monitor traffic, investigate data, and understand your users and their activity.
When you open Reports from the navigation pane, you will see the following options:
- Reports snapshot: A type of overview report that summarizes data about a topic. Learn how to customize the Reports snapshot.
- Realtime: The Realtime report lets you monitor activity on your website or app as it happens, such as the number of users during the last 30 minutes. This is a good place to start when checking that a newly installed Google tag is collecting data.
- Report collections: The set of reports below the Reports snapshot and Realtime reports on the left are called report collections. Collections consist of an overview report and detail reports.
- The initial report collection is based on information provided when setting up a property.
- Editors and Administrators can customize report navigation by going to Reports > Library.

How events work in Google Analytics 4.
At the center of the Google Analytics 4 data model are events and event parameters. An event allows you to measure a specific interaction or occurrence on your website, such as when someone loads a page or clicks a link. For a detailed look at events data, you can check out the Events report to view how many times each event is triggered and how many users trigger each event on your website. By analyzing the events, you can make improvements to the user experience.
The following types of events are collected automatically:
- Automatically collected events: Data collected by default when you set up Google Analytics on your website or app.
- Enhanced measurement events: Data collected if the enhanced measurement option is enabled when adding a data stream.
You must manually configure and implement the following types of events in order to see them in Analytics:
- Recommended events are events that you implement, but that have predefined names and parameters. These events unlock existing and future reporting capabilities.
- Custom events are events that you define. Custom events should only be created when no other events work for your use case. Custom events don't appear in most standard reports and must be set up in custom reports or explorations for analysis.
Customize Reports and Tools
You can further customize the reports described above. Each Google Analytics property can have up to 150 custom reports.
- Customize overview reports and the Reports snapshot: You need the Editor role on the property to customize overview reports.
- Customize detail reports: As an Editor or Administrator, you can customize a detail report to change the data shown in the report.
Additionally, you can configure these advanced tools to further extend Analytics.
- Customize Analytics Insights: Analytics Intelligence is a set of features that uses machine learning and conditions you configure to help you understand and act on your data. You need the Analyst or Editor role to create, edit, and share insights.
- Get started with Explorations: Explorations is a collection of advanced techniques that go beyond standard reports to uncover deeper, more granular insights about user behavior. You can use explorations to perform ad hoc queries, sort, refactor, and drill down into the data, focus on the most relevant data by using filters and segments, and more. You can create up to 200 individual explorations per user per property and up to 500 shared explorations per property.
- Custom dimensions and metrics: Custom dimensions are used for visualization in reports and provide functionality for capturing taxonomies about pages, events, and users. You can create between 10-50 custom dimensions and metrics based on type.
Activate Google Signals
Google signals are session data from sites and apps that Google associates with users who have signed in to their Google accounts, and who have turned on Ads Personalization. This association of data with these signed-in users is used to enable cross-device reporting and collect data about demographics and interests.
To activate Google signals, you need the Editor role for the property.
- In Admin, under Data collection and modification, click Data Collection.
- Turn on the switch for Enable Google signals data collection.
- When you activate Google signals, that data is collected in all regions by default.
- If you want to choose the regions in which Google signals data is collected, click the settings icon in the section titled Google signals data collection is allowed in X of Y regions. Turn the switch on or off for each region in which you want to allow or disallow collection of Google-signals data. Click Apply.
- Be sure to review the Data Privacy section of this guide for information about Berkeley Lab privacy policies and other regulations.
Filter internal traffic
Exclude internal traffic from measurement. You can filter out website activity from an IP address or a range of IP addresses so the data generated by users at those IP addresses don't appear in your reports. You can create up to 10 data filters per property.
Filter unwanted referrals
Referrals are the segment of traffic that arrives on your website through another source, like through a link on a third-party domain. Unwanted referrals from specific domains can be manually filtered with traffic from known bots being automatically excluded. You can configure a maximum of 50 unwanted referrals per data stream.
Create campaign links
By adding UTM campaign parameters to the destination URLs you use in referral links and communications, you can more easily track which campaigns refer traffic to your site. When a user clicks a referral link, the URL parameters are sent to Analytics and the parameter values are visible in the Traffic acquisition report.
You can add parameters and values to your URLs manually or use a URL builder tool like Google Analytics Campaign URL Builder. The target link can be further simplified with the go.lbl.gov URL shortener tool.
Google Search Console
Google Search Console helps you monitor, maintain, and troubleshoot your site’s presence in Google Search. Search Console offers tools and reports to help with the following actions:
- Confirm that Google can find and crawl your site.
- Fix indexing problems and request re-indexing of new or updated content.
- View Google Search traffic data for your site:
- How often your site appears in Google Search
- Which search queries show your site
- How often searchers click through for those queries, and more!
- Receive alerts when Google encounters indexing, spam, or other issues on your site.
- Show you which sites link to your website.
Google Analytics offers direct Search Console integration and makes additional reports available to analyze organic search results. You need the Editor role on the Analytics property to link it to Search Console and you must be a verified owner of the Search Console property. Verification can occur during the linking process.
Link Google Analytics and Search Console
- In Admin, under Product links, click Search Console Links.
- In the link table, click Link.
- If you are a verified owner for Search Console properties, in the row for Link to Search Console properties I manage, click Choose accounts, then select the account you want to link your property to.
- Click Confirm.
- Click Next.
- Select the web data stream for your site.
- Click Next, then review and submit your configuration settings.
Recommended for:
- Users who administer websites or manage a Google Analytics account.
- Communications and marketing specialists.

The relationship between your site, Google Tag Manager, and Google Analytics.
Google Tag Manager
Google Tag Manager is a system that lets you configure and deploy Google tags on your site from a web interface. Tag Manager also includes support for tag organization, development and debugging environments, and version control. For users who manage many websites or Analytics accounts, using Tag Manager can help optimize tag deployment, reduce configuration errors, and allows you to make modifications instantly across multiple sites from one location. Experienced users who are creating custom events may also find Tag Manager more intuitive and easier to deploy.
If you decide to maintain and organize your tags in Google Tag Manager instead of Analytics, you should Configure Google Analytics in Tag Manager first. Once the initial setup is complete in Tag Manager, you will end up with a Google tag in the format GT-XXXXXXXXX or GTM-XXXXXX. You can then complete installation of the tag on one or more websites using the same Analytics guidance described in Step 2 of Set up data collection.
Recommended for:
- Users who manage many websites or Analytics accounts.
- Users who want to configure events across multiple sites.
Looker Studio
Looker Studio is a tool for using data to build interactive reports and visually rich dashboards. You can connect to multiple data sources, including Google Analytics. Search Console, Google Sheets, Smartsheets, and more. Looker also makes it easy to schedule automatically delivered reports of your data via email.
If you don’t want to start from scratch, you can create a report from the template gallery, create a new template from any Looker Studio report by appending “/preview” to the end of a Looker URL, or copy a report to which you have access. For further inspiration, take a look at examples of Looker Studio dashboards at Berkeley Lab:
Connect to Google Analytics in Looker Studio
You must have at least Viewer access to the Google Analytics property in order to connect to it in Looker Studio.
- Sign in to Looker Studio.
- On the Looker Studio home page, in the top left, click the + Create button and then select Data Source.
- Select the Analytics connector.
- If prompted to grant Looker Studio access to your account, click AUTHORIZE.
- Select an account.
- Select a property.
- In the upper right, click CONNECT.
- The data source fields panel appears.
- The data source is now connected to your data set.
Recommended for:
- Data analysts, business intelligence subject matter experts, and communications specialists.
- Users who want to send reports to stakeholders on a regular basis and find the Analytics sharing options too limited.