As you (hopefully) know, IT Division is a big proponent of the importance of researchers choosing the productivity tools they feel most comfortable with. We've actually fought pretty hard against some folks to try to convince them what we think is true: the benefits of standardization are meager, and are far outweighed by the productivity gains of letting our community make informed choices about the tools they want and how to allocate their resources. So, it's time for our irregular check in on laptop trends.
Why Laptops: Because our data on desktops isn't as easy to parse. Desktops get used for a lot of different things (attached to scientific equipment, lab data collectors, parts of experiments, etc). Laptops, we think, are generally a better proxy to understand what end users are using as their go to computer platform.
Chart 1: Count of Laptops Currently in Use (in property database) in Scientific Divisions by Year of Purchase
|
|
|
|
Apple |
Windows/Linux |
2006 |
120 |
165 |
2007 |
167 |
226 |
2008 |
278 |
265 |
2009 |
302 |
304 |
2010 |
365 |
360 |
2011 |
380 |
305 |
2012 |
104 |
96 |
Chart 2: Count of Laptops Currently in Use (in property database) in All Divisions by Year of Purchase
|
|
|
|
Apple |
Windows/Linux |
2006 |
175 |
282 |
2007 |
200 |
328 |
2008 |
334 |
358 |
2009 |
357 |
446 |
2010 |
397 |
485 |
2011 |
449 |
463 |
2012 |
122 |
110 |
Chart 3: Laptops in Use (in property database) by Division 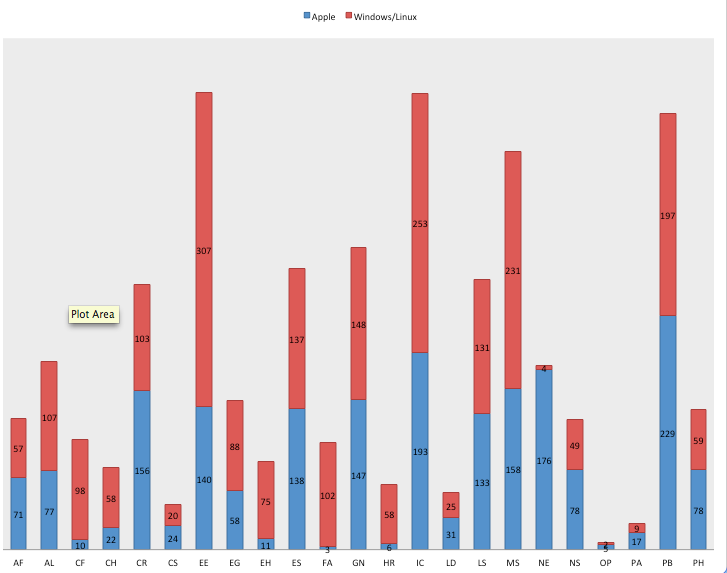
Chart 4: Laptops in Use by Division - Just for 2011-2012 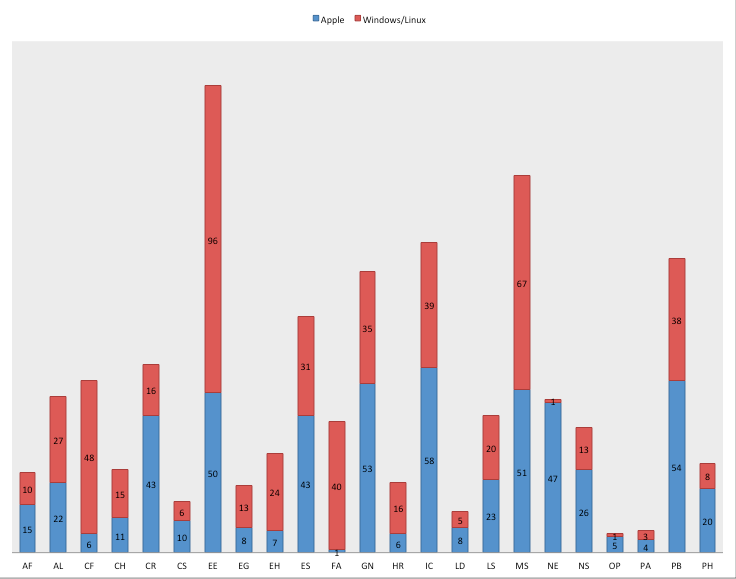
Conclusion: We remain nicely heterogenous. The trend towards OSX in the laptop space is decelerating, but continuing. All but one scientific division remain decidedly mixed in their platform choices.
Most computers at LBL are bought in the last three months of the year, so the numbers for FY12 are not yet representative. We'll recap at the end of the FY.
LBNL is a pretty big place. If you're an employee who hasn't been around forever, you've probably wandered past buildings and wondered what kind of cool science goes on in there. And if you're a member of the community, outside of tours and websites, you might just get glimpses of buildings and wonder about them.
We're getting ready to change that.
IT, Facilities, and Public Affairs are working with a company that provides highly detailed interactive maps to college campuses that are filled with interesting information. We hope to have this project completed by late Fall 2012.
The project will come in phases, with a new 3-d color campus map replacing our existing static campus map, followed by layering of many kinds of content about what goes on in our buildings, what divisions are where, and more.
Of course, it's mobile enabled, and you'll be able to download this map as an app or use it as a web app on your mobile device - and you'll be able to see your current location on the map while you're here at the lab.
Over time, we'll continue to add more content to the map.
When we get our first renderings, I'll post again.
I'm really excited about a new map for the lab that helps tell the story of the great work that goes on here, as well as helping you find your way around.
-as
ps - to get a sense for what these maps look like, check out the recently completed map of Sweet Briar College http://www.sbc.edu/map/
The IT Division is offering a series of Excel training courses over the next six months for beginner, intermediate, and advanced users. In addition, we will also offer a special advanced session titled "Excel for Science" based on feedback we received from our recent LabTech event. To register for the course go to: https://hris.lbl.gov/self_service/training
The schedule and course descriptions are listed below:
Course Title |
Course Outline |
Date |
Time |
|---|---|---|---|
BEGINNER |
|
|
|
Excel Essentials & Intro to Formulas & Functions (Module 1) |
Introduction to the Excel 2010 interface, the ribbon, the backstage view & the quick access toolbar, zooming in and out of a worksheet, navigating and selecting cells, keyboard shortcuts, entering and editing data, deleting/replacing cell data, performing simple calculations, saving the workbook file, checking compatibility with older versions of Excel, overview of the formulas ribbon, building basic formulas, using simple functions, copying formulas/functions with the autofill command, using relative and absolute cell references in calculations. |
June 13, & |
8:00am-12:00pm |
Formatting Spreadsheet Design, Page Setup & Printing (Module 2) |
Inserting rows & columns, moving & copying data, using autofill to complete a series of values, introduction to worksheet themes, formatting worksheet data/using cell styles, using excel templates/creating custom templates, managing worksheets - inserting, deleting, renaming, move/copy, grouping worksheets, freezing or splitting panes, creating custom views, spell checking your worksheets, setting print options through page setup, using the page layout view, printing your worksheet. |
June 13 & October 24 |
1:00pm-5:00pm |
INTERMEDIATE |
|
|
|
List/Table Essentials & Charting |
Overview of list design, formatting lists as tables, single and multi-level sorting, removing duplicates from a list or table, filtering records in a list or table, search by filter, inserting automatic subtotals in a list, inserting data charts, formatting and editing chart elements, adding/removing data from a chart, creating custom chart templates, printing charts, changing table and chart formatting through themes, inserting sparkline. |
August 8 & November 7 |
8:00am-12:00pm |
Importing Data, Pivot Tables, Protecting & Linking Data |
Importing data from other sources, overview of exporting options, creating a database query, creating pivot tables from lists or tables, filtering pivot tables, using the slicer tool within a pivot table, working with pivot charts, applying data validation rules, applying built in conditional formatting, creating custom conditional formats, inserting & editing comments, linking data, cell, sheet, and file protection. |
August 8 & November 7 |
1:00pm-5:00pm |
ADVANCED |
|
|
|
Creating Advanced Functions |
Creating and applying names in a worksheet, using the IF function, introduction to nesting functions, using the formula auditing tools, using the LOOKUP functions, using SUMIF(S), COUNTIF(S), AVERAGEIF(S) functions, using the IFERROR function, other useful functions (Database, Text and Date Functions - time permitting) |
October 10 & November 14 |
8:00am-12:00pm |
Using the "What If" Analysis Tools & Recording Macros |
Using the consolidate data commands, using the goal seek and solver tools, creating data tables, using the scenario manager, adding the developer tab to the ribbon, recording and running macros, editing macros with the visual basic editor, creating buttons to run macros (quick access toolbar & worksheet buttons), microsoft skydrive overview, customizing the ribbon. |
October 10 & November 14 |
1:00pm-5:00pm |
SPECIAL |
|
|
|
Excel for Science |
Database Management & Pivot Tables: list design, sorting and filtering, subtotals, pivot tables, advanced functions in pivot tables, data validation, LOOKUP functions, database functions; |
September 26 & December 12 |
8:00am-5:00pm |
*Please note some of the classes may not appear in Employee Self Service due to the date range made available in the HRIS training schedule.
|
|---|
Matlab Seminar: June 12 |
The IT Division is hosting two seminars from Mathworks on Tuesday June 12 in the Bldg 50 Auditorium. You can register with Mathworks using this link which helps us plan for the event (or just show up).
10am - Noon
Session 1: Data Analysis and Visualization with MATLAB
During this technical presentation, we will introduce specific examples to demonstrate how to acquire, analyze and visualize data through mathematical, statistical and engineering functions that support common engineering operations. We will also provide an overview of the MATLAB technical computing environment, including desktop tools for editing and debugging code, publishing your work, surface fitting, and creating graphical user interfaces (GUIs).
Highlights include:
- Importing data and images into MATLAB
- Performing statistical analysis and curve fitting
- Automating analysis via MATLAB code generation
- Developing algorithms and applications
- Building GUIs and generating reports
- Creating standalone executables
2pm - 4pm
Session 2: Parallel and GPU Computing with MATLAB
In this session you will learn how to solve computationally and data-intensive problems using multicore processors, GPUs, and computer clusters. We will introduce you to high-level programming constructs that allow you to parallelize MATLAB applications and run them on multiple processors. We will show you how to overcome the memory limits of your desktop computer by distributing your data on a large scale computing resource, such as a cluster. We will also demonstrate how to take advantage of GPUs to speed up computations without low-level programming.
Highlights include:
- Toolboxes with built-in support for parallel computing
- Creating parallel applications to speed up independent tasks
- Scaling up to computer clusters, grid environments or clouds
- Employing GPUs to speed up your computations
This month's issue of HPC Admin Magazine features the first in a 4-part series of in-depth articles on how to use the LBNL Warewulf Cluster Toolkit. Warewulf was developed here at Berkeley Lab by HPC Services Greg Kurtzer and it pioneered many of the stateless methods that other cluster toolkits use today. It is considered the standard stateless open source toolkit for clustering and is widely used by the HPC community. More ...

Advanced Light Source (ALS) physicists Changchun Sun and Hiroshi Nishimura along with HPC Services staff Kai Song, Krishna Muriki, Susan James, Yong Qin, Bernard Li, and Gary Jung recently explored several methods to use Amazon's VPC service to transparently extend the ALS compute cluster, located here at Berkeley Lab, and their software environment into the public Cloud in order perform Accelerator Simulation. Their work was presented during the poster session at the International Particle Accelerator Conference 2012 in New Orleans this week
Scientific conferences, reviews, and meetings are a critical part of our work at Berkeley Lab. IT offers a number of tools to help you with the lifecycle of conference planning.
Conference and Meeting Websites
Simple |
Complex |
|---|---|
Google Sites |
Conferences.lbl.gov |
Registration and Attendee Information
You can create simple and complex registration forms with Google Docs forms. Gather anything from lunch preferences to travel plans (but no credit cards).
Event Communication
Build simple mailing lists withLists.lbl.gov (Sympa) or Google Groups to keep in touch with attendees and organizers.
Audio Visual Support
Updates to conference rooms are currently under consideration. Most conference rooms and all auditoriums have self-service audio visual. Additional av support is available from a contract-support firm through IT. Contact [email protected] for details.
Streaming, Video Conferencing, and Recording
Some conference rooms have Lifesize Video Conferencing Units with many more under consideration for deployment. You can conduct traditional video conferences from these units, but also live stream your meeting or seminar to the web. This streaming service is free of charge and can serve hundreds of viewers simultaneously. Other options are available for other situations.
Readytalk audio and web conferencing is also an excellent way to share your meeting with a larger audience and include people who can't be there in person.
Post Conference Surveys
Use Google Forms to conduct post-conference surveys and get feedback.
Questions
Contact [email protected] for information about any of these tools and advice about getting the most out of them.
The GQueues product continues to improve. If you need a task manager built into our Google Apps Suite of tools, go to the "More" link and click on GQueues.
New to Gqueues? Start Here
New Look (re-posted from a company announcement)
In case you haven't noticed....GQueues got a facelift this past weekend! The re-design is based on direct feedback from the user community.
While the new, cleaner look makes it easier to read and manage tasks, it also enables the addition of several new features users have been clamoring for:
- Colored tags and the ability to sort and group by tags
- Overdue tasks highlighted with red dates
- The option to display the task creation date
- A compact view to show more tasks on the screen at once
Gmail Web Interface Integration
A button (called a "contextual gadget") will be added to the bottom of each message when using the Gmail web interface. This feature will allow users to create a task from within Gmail. A reference to the originating mail is preserved.
Deployment is planned for Wednesday, May 16.
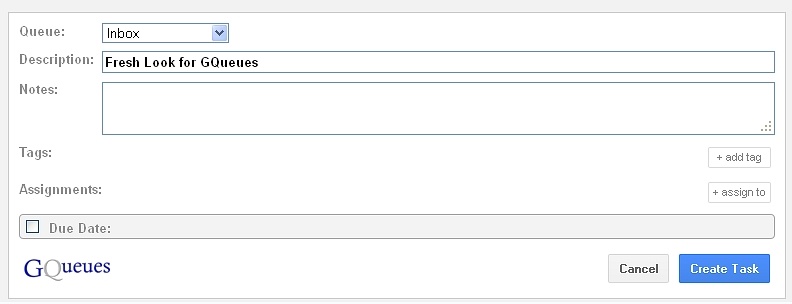
This is what the button looks like:

When you "create a task", the dialogue looks like this (the default queue is the inbox, but you can select which one is best for this task):
There will be a brief interruption of telephone service for both incoming and outgoing calls including all offsite locations (Potter, JBEI, Leap Frog, and OSF). The AT&T work is scheduled on Tuesday, May 15th 2012 due to telephone network upgrades. Work will begin at 5:30 p.m. and may last up to 12:00 a.m. During this time, telephones may be out of service for up to one hour. If you are in an affected off-site building (Potter, JBEI, Leap Frog, and OSF) and there is a life-threatening emergency, dial 911 from a cellular phone. To report incidents that are not life threatening, dial 486-6999 from a cellular phone. A telephone technician will be onsite to monitor each location and can be contacted at 486-5011 if necessary. Please contact Telephone Services (x7997) for any questions
Software.lbl.gov, LBNL's software distribution site, now sells popular iOS applications. You can use your Laboratory ProjectID to purchase work-related applications to your device.
To find applications, visit http://software.lbl.gov, click Purchase Software, scroll down to iOS App Store, then select your application.
At launch, the store sells licenses for:
Papers
Pages
Keynote
1Password
QuickOffice
OfficeHD
Noteshelf
Circusponies
If there's something else we should carry, please drop us a line at [email protected]
Google just announced in their Official Enterprise Blog today that they are releasing Google Drive to consumer and Rapid Release Google Apps domains. Berkeley Lab is on Rapid Release.
What is Google Drive?
With Google Drive, your users can securely upload any file or folder to the web and access the most up-to-date versions of those files from anywhere. Users can access Google Drive in their web browser and can also download the Drive application to their Mac, PC, Android or iOS devices to seamlessly access files across any of these devices. Each user will have 5GB of included storage space for their Google Drive.
The Product Information Page is here.
To see what the install process looks like, we captured a few of the steps in screen shots and added them to our Google Help Center Google Drive Page.
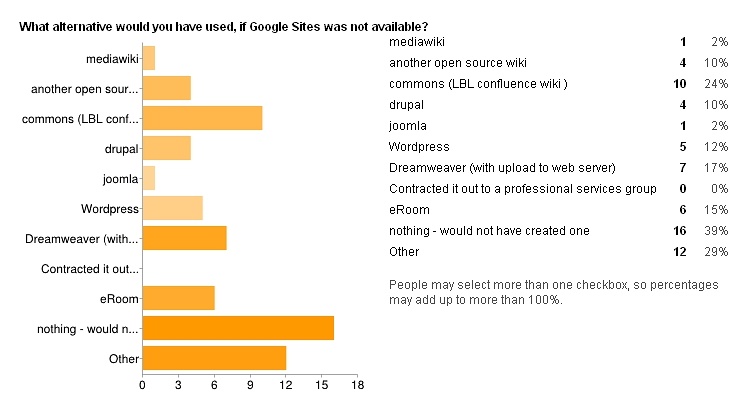
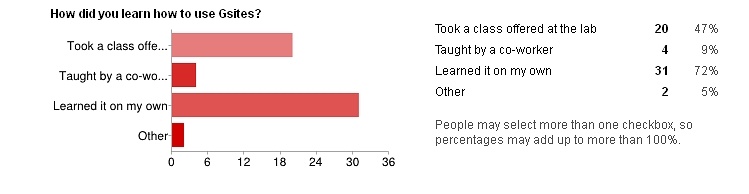
A quick survey of Google sites users turned up some interesting results. (survey done with Google Docs>Forms tool)
Collaborative Team sites was the category chosen most often. We are speculating that conferences and workshops will be a use case that will increase in the future.

We think it is interesting that over a third of the responses indicated they would not have used another tool if Google Sites was not available. Collaboration via email and attached office docs would probably have been the alternative. All these alternative methods for web site creation either require effort to configure a server or cost something for the tool itself (Dreamweaver). Google Sites came with our move to Gmail and calendar at no extra cost. (Examples of tools mentioned in the "Other" Category: PBworks, other open source wikis running on Linux, shared network drive, raw HTML)
A large percentage took the Intro to Google sites class - but we assume the 72% response for "Learned it on my own" also indicates that other features were explored after class, for those that attended. (We have seen a drop off in registrations for the Introductory class - so we are speculating that only advanced topics are now of interest and that introductory material will be self taught or learned via a coworker).
We asked for ideas on what the product was missing in functionality. Here are some of the responses.
- The ability to handle larger size document is most needed.
- Better table formatting support.
- I don't like the size and placement constraints on images that I upload to the site
- The same type of "plug-in" document upload process that eRoom had
- Need more template options
- Allow for some way to format attached files display (default order is alphabetical).
- Database (PostgreSQL/MySQL) support
What was installed:
Cluster Support:
- Approximately 18.2kW
Business Systems:
- No new systems
What was removed:
Cluster Support:
- Approximately 2kW
Business Systems:
- None
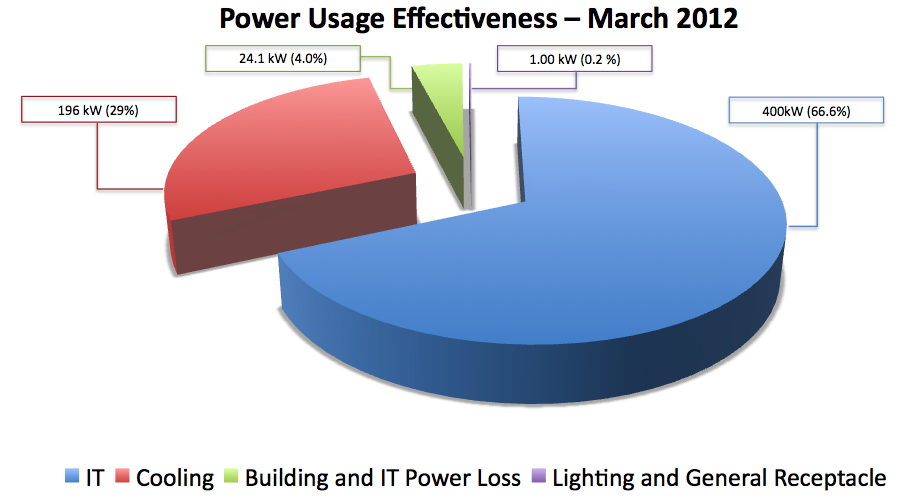
March average Power Usage Effectiveness (PUE): 1.46
- Average Power Consumption:
- 410kW IT
- 1kw Lighting
- 23.0kW Building and IT Losses
- 165kW Cooling Power - unknown due to sensor error
- Average Cooling Load: 116.5 tons
Data Center Efficiency Progress:
The DOE national average PUE for data centers is 1.75. 50B-1275 data center has evolved from an average PUE of 1.65 (calculated in 2009) to today’s 1.47. Getting there, staying there, and further improving the PUE is an ongoing effort.
Key highlights for this month include:
- Updates were suspended the last two months due to sensor read out failures. A water temperature sensor was replaced and a IT load electrical meter failed. The meter is expected to be replaced within the next week. Manual readings from the meter were taken and entered into the calculations to establish proper PUE.
- The new VFD software to automatically control air handler air flow is in final testing and expected to be installed soon. The current software is disabled.
- Testing using the current software revealed problems with two of the 15 ton air handlers. Bot have hot gas expansion valves fluctuate which make it difficult to control the air handlers. Two valves in one of the units are currently being replaced.
- In November we reported raising the room temperature slightly. The resulting affect has been continued failure of floor tiles, which become delaminated.
HPC Services senior engineer Michael Jennings will be talking about the new features of the Warewulf 3 cluster toolkit and about a new cluster Node Health Check program that he developed at this week's Moabcon 2012 conference in Promo, Utah this week.