With the Help of Property Management and Procurement, we were able to come up with statistics on recent computer workstation purchase trends (as compared to the total inventory as recorded in the Property System). We also added in recent estimates of lab issued smartphones
Workstation Trends
Device |
Total Inventory Dec 2011 |
Apple inventory |
Total FY10 purchase |
Apple FY10 purchase |
Total FY11 purchase |
Apple FY11 purchase |
Desktops |
7471 |
1284 |
901 |
199 |
806 |
168 |
Laptops |
4796 |
2030 |
828 |
327 |
960 |
470 |
Tablets |
299 |
266 |
77 |
77 |
215 |
183 |
Smartphones |
630 |
600 |
|
|
|
|
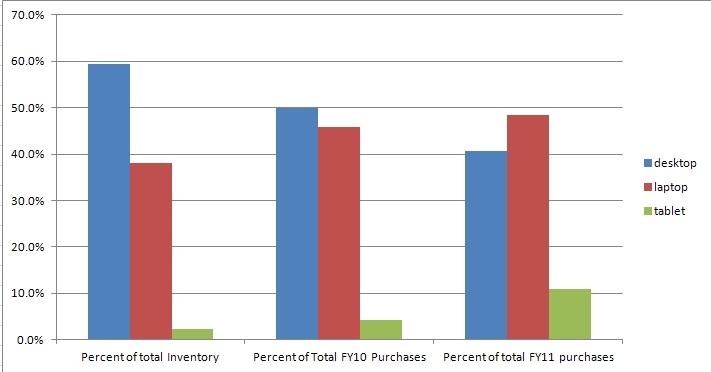
Trends: more mobile devices, more Apple. Also multiple devices per person
Note: The lab has several thousand affiliates and computer's associated with scientific instruments so the computers/career employee can not be generalized beyond our type of business
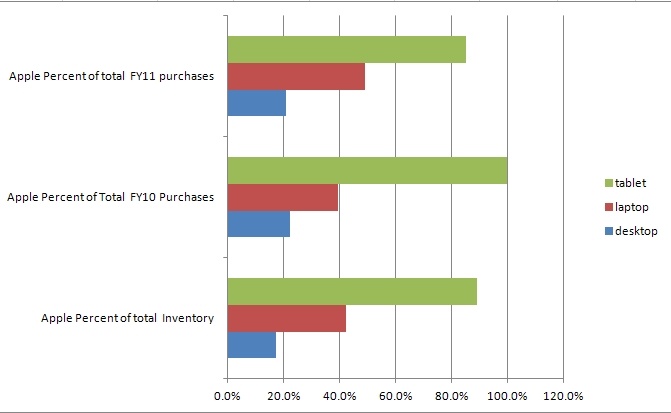
Visualized graphically, the data looks like this:
Apple "market share" - in mobile devices (laptop, tablets). For a number of years, Mac Laptops have been widely used - so the most recent two years do not show a dramatic change. In FY10, the only tablets were iPads, but we are starting to see a few others now (e.g. Samsung Galaxy).