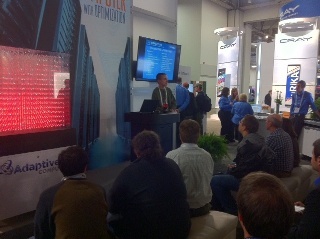
HPC Services staff Jackie Scoggins and Michael Jennings gave a well-attended presentation on Node Health Check (NHC) software today at the Adaptive Computing booth at SC12. NHC, an open source project developed by Jennings, works in conjunction with Adaptive Computing's Moab job scheduler and their open source Torque resource manager to check the health of compute nodes in order to ensure clean job runs on large production HPC systems.
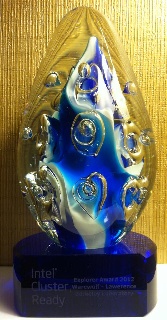
The Berkeley Lab Warewulf Cluster Toolkit development team has been honored with the 'Explorer Award' from the Intel(R) Cluster Ready team at Intel, which recognizes organizations who have continued to explore and implement Intel Cluster Ready (ICR) certified systems. The award was presented to Warewulf developers Greg Kurtzer, Michael Jennings, and Bernard Li of the IT Division's HPC Services Group yesterday at the annual Intel Partners Appreciation breakfast held at Supercomputing 2012. The award was given as a result of the joint activities between the Berkeley Lab and Intel to certify and promote Warewulf 3 as an open source, zero-cost Intel(R) Cluster Ready solution for provisioning and managing large HPC cluster installations.
HPC Services staff member Yong Qin was part of a panel, along with other Berkeley Lab scientists from the Environmental Energy Technologies Division, at the Silicon Valley Data Center Efficiency Summit 2012 last week in San Jose talking about Berkeley Lab's recently released study to understand the feasibility of implementing Demand Response and control strategies in Data Centers. Yong discussed the issues and our experiences related to reducing or geographically shifting computational workload to a remote data center as a response to a demand to lower electrical usage.
In another session, IT Division Infrastructure group lead Ed Ritenour presented our work with SynapeSense to convert our CRAC (Computer Room Air Conditioning) cooling units to use sensor driven VFD (Variable Frequency Drives) to automatically adjust the cooling in the Data Center to meet cooling demands and save power. ![]()
The Plan
We will be upgrading Commons to Confluence 4.2 on Sunday, 11/4, starting at 10am. The system will most likely be up within 3 hours, but a number of manual adjustments will be required post-upgrade, causing some pages to have display issues beyond that time.
Commons hosts a number of external facing websites, including BISICLES, Chombo, CIO, Facilities, Human Resources, IT Division, Neaton Group, Nuclear Science Division Safety Culture and sustainLBL.
Impact
Wiki markup - the way pages were written and stored in the past goes away. Content will now be stored natively in HTML5 and a richer editing experience will become available. This represents the single biggest upgrade we have undertaken since Commons was first deployed at the lab.
With 4.2 comes a significant upgrade in page editing capabilities. For more information, go here.
Gdrive - the new UI will soon become the default
Google is going to start rolling out changes related to the Google Drive User interface - here is the current schedule.
From 8th November
Google will begin showing a banner to all users who have opted out and are using the old look for Docs.
The banner will read “The old look of Google Docs will be going away soon - Upgrade” and will include a link to allow users to switch to the Drive web interface.
From 15th November,
Users who have opted out will be automatically switched over to the new Drive web interface.
Users can still switch back to the old Docs look (by clicking the gears icon and selecting 'Temporarily use the old look"). If users revert to the old look, they will again see the banner advising them that the old look is going away.
From 29th November
All users who have reverted to the old Docs look will be switched to the Drive web interface again for the last time.
At this time, the ability to switch back to the old Docs look will be disabled and the new Drive web interface will be mandatory for all users.
IT is sponsoring another 2 hour Matlab seminar in the bldg 50 Auditorium on Thursday, October 11
Presenter: Saket Kharsikar, MathWorks Application Engineer
Agenda
1:30 – 3:30 p.m.
Advanced Graphics and Visualization Techniques with MATLAB
This session will focus on visualizing data, viewing images, and manipulating graphics in MATLAB. We will explore techniques for customizing graphical displays, generating animations, and creating publication quality graphics. We will present approaches to working with and displaying large data sets and images, and will discuss data importing, block-processing and re-sampling. Finally, we will investigate the visualization of higher-dimension data, with a focus on volumetric slicing and vector fields.
Highlights Include:
- Introduction to Handle Graphics
- Creating Animation
- Customizing Graphics
- Analysis of Large Data and Imagery
- Techniques for Higher- Dimension Visualization Parallel Computing with MATLAB
Register at http://www.mathworks.com/seminars/LBNL12 (although this is not mandatory, it will help us plan for the event).
The lab’s standard anti-virus software, Sophos, is continually updated with the latest information about viruses. Today at 1:20pm, Sophos released an update which is causing many clients to incorrectly report they are infected with Shh/Updater-B. If you receive one of these warnings it is safe to ignore it. We are actively working on the problem and mitigation.
There is now a fix available - please visit http://go.lbl.gov/sophos
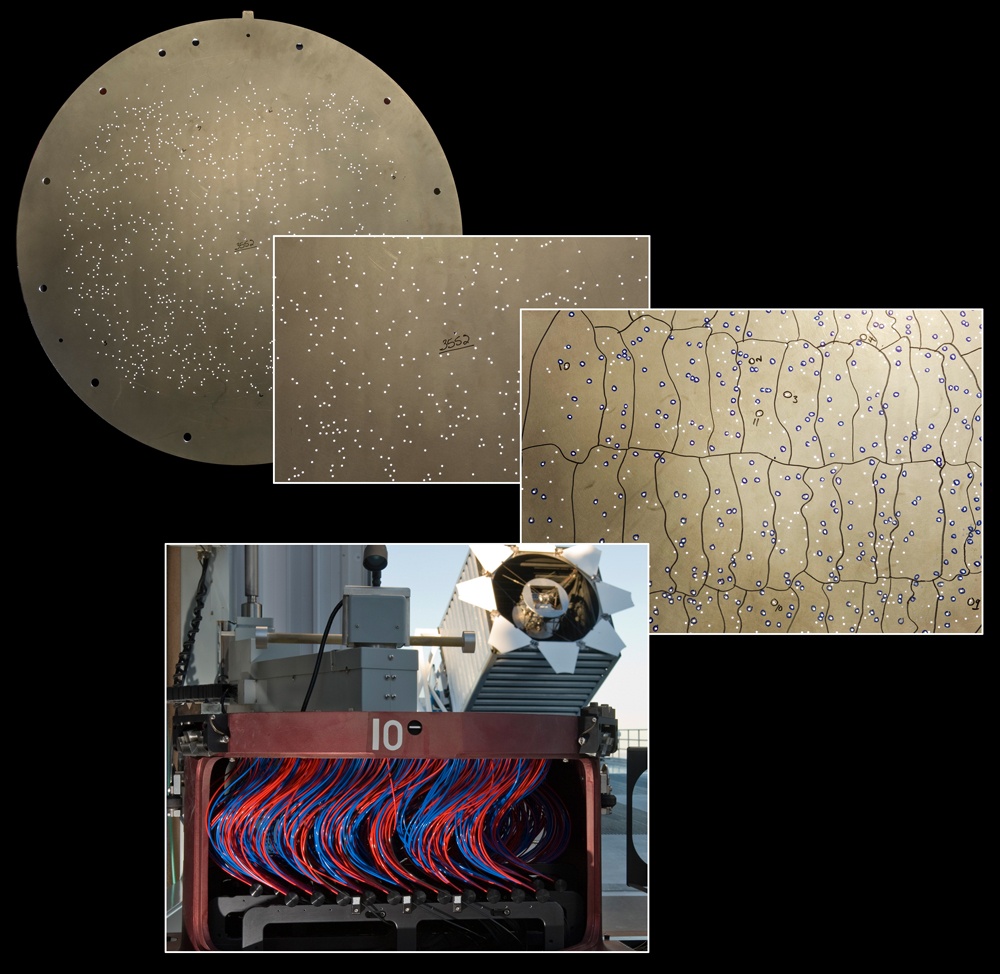
The first data from BOSS, the Baryon Oscillation Spectroscopic Survey led by Berkeley Lab scientists, is now available to the public. Spectroscopic data from over 500,000 galaxies up to 7 billion light years away, more than 100,000 quasars up to 11.5 billion light years away, and many thousands of other astronomical objects are included in the Sloan Digital Sky Survey’s Data Release 9. BOSS is the largest spectroscopic survey ever for measuring evolution of large-scale galactic structure.
Working with LBNL PI David Schlegel and Adam Bolton at the University of Utah, Berkeley Lab’s Stephen Bailey is in charge of daily “extraction pipeline” operations that convert raw data from the telescope into useful spectra and quantities derived from them, ready for scientific analysis. The data storage and the extraction pipeline run on the Riemann, 37-node Linux cluster, hosted and maintained of Berkeley Lab’s High Performance Computing Services Group. The Lab also hosts the SDSS-III website, http://sdss3.org, from which the data can be downloaded. Go here to read more.
. 
The Berkeley Lab Technology Toolkit is what we call the set of services we provide for every employee at the Lab at no recharge. We try to make sure that the most important services everyone needs are covered as part of the Toolkit. Here’s an overview of what’s in the toolkit (aka funded by overhead or sometimes direct funding, but not recharge). This isn’t a completely exhaustive list - to learn more about any of these services including their funding model, visit it.lbl.gov.
The Network:
A fast, flat, wall to wall network optimized for scientific data flows and visitor and employee wifi are included with no ongoing charges, bandwidth charges, or bandwidth limitations. Special services like virtual circuits between institutions are also included. If a new network drop, initial building wiring, or a new access point is required, these are recharged for installation, but there are no ongoing charges for network access.
Library:
The library, research databases, and electronic journals are all provided to all staff - the same ones available to faculty at UC Berkeley. Interlibrary loan requests may have an associated recharge, but all electronic resources are availalbe to all. The library proxy, elinks, and fast book/article delivery from UCB are all included in the Toolkit.
Collaboration and Productivity Services:
Core productivity and collaboration services are all provided for all. The entire Google Apps Suite, which includes 25GB email, calendar, docs, storage (drive), sites, and more is available to all employees. This combination of services provides an excellent baseline for small to medium size collaborations for shared files, external and internal websites, and collaborator management. Mailing lists via lists.lbl.gov and Google Groups are both provided, as well as extension tools like Smartsheets for simple project management. 1:1 and multi-person video conferencing are also available via Google Apps. Space on the institutional wiki Commons is also available at no recharge. If you’re developing code - version control and issue tracking services are also available at no recharge. Software for managing and promoting scientific conferences is also included (Indico).
Storage:
With Google Drive, you can store and share unlimited files in your Google Account and access them from anywhere. With Google Drive File Stream, Backup and Sync, Command Line Tools, and Globus, you can build science workflows that leverage Google Drive file storage to fit virtually any use case.
Software:
Site licensed software is available to all via software.lbl.gov, including antivirus software for all plaforms, virtual private networking (VPN), and security software like bigfix and identify finder. Non-site licensed software is available via recharge/passthrough, and employees generally benefit from excellent negotiated rates on these packages, thanks to overhead funded resources who search out and negotiate great laboratory pricing on software.
Cyber Security:
Cyber security monitoring, vulnerability scanning, consulting, training, and incident management are all provided at no recharge. While securing systems is an individual/group responsibility, these monitoring, coordination, and consulting services are all provided to all. In fact, Berkeley Lab runs of one of the most sophisticated "science-friendly" cyber security programs around - numerous layers of protection are in place, but all are designed to let researchers collaborate, experiment, and test without undue burden or interruption.
Identity and Authentication:
Your Berkeley Lab Identity username and password, and your active directory account (and all the infrastructure behind them) are all provided at no recharge. Your Berkeley Lab Identity can even be used to authenticate to services at other institutions via federated identity. In addition, a one time password service and gateway service are provided at no charge to help protect scientific systems from the treat of compromised credentials.
The Helpdesk:
There is never a charge for calling the helpdesk with an IT-related question. From basic office app issues to password resets, to help with collaborative tools, the helpdesk can answer most questions and find someone to help if they can’t. Recharges may apply if a tech needs to be dispatched to work on your computer if you don’t have local technical support and aren’t already supported by IT Division.
Archives and Records:
Scientific records archiving is provided at no cost for research records. Staff will even come out and process your scientific records for free.
Training and User Communities:
IT provides a program of training courses geared to both scientists and administrative staff. These include everything from introductory courses on the Google Apps Suite, to specialty courses on scientific programming in Python, to courses on approaches to software project management. In addition, the lab provides resources to support user communities around software development (coders) cyber security (cycom) Apple products (mug), and Google (gug).
And, Much More
There are lots of other services, like mail hygiene and routing, DNS services, reference services, publication management, and more that are also included, but the ones above are the big ones.
Visit the IT Services page to learn more about any of these services. And if you have any questions about how services are funded, where you money goes, or have suggestions for us, drop us a line at any time at [email protected]
What was installed:
Cluster Support
- Received NSD cluster of 21 nodes (Not yet operational)
- Expected power usage is 6kW
Business Systems Group
- None
What was removed:
Cluster Support Group
- Approximately 10kW
Business Systems Group
- None
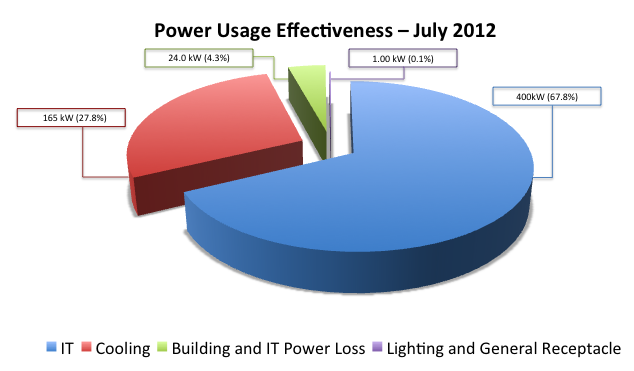
July average Power Usage Effectiveness (PUE): 1.47
Average Power Consumption:
- 400 kW IT = 67.8%
- 1 kW lighting = .1%
- 24.9 kW building and IT losses = 4.3%
- 165 kW cooling power = 27.8%
Data Center Efficiency Progress:
The DOE national average PUE for data centers is 1.75. The 50B-1275 data center has evolved from an average PUE of 1.65 (calculated in 2009) to today's 1.46. Getting there, staying there, and further improving the PUE is an ongoing effort.
Key highlights for this month include:
- Updates were suspended the last two months due to sensor read out failures. A water temperature sensor was replaced and an IT load electrical meter failed. The meter sensor was replaced.
- New VFD software to automatically control air handler air flow has now gone through final testing by the vendor and the new software has been down loaded to our server.
- The hot gas pressure valves have been replaced in the two 15 ton air handlers and appear to be working correctly.
- During August we will be working with the vendor and EETD on the VFD drive testing plan.
The Systems, Application, and Middleware Support Group (SAMS) will perform work on the NetApp file server “Grouper” on Friday Aug 10, 2012 from 6:00pm-10:00pm. This is to replace its current storage controller with a newer model. During this storage upgrade, the services listed below will be unavailable:
Commons
Conferences (Indico)
Desktop Management Files
EETD hosted web sites
EETD-Synapsense
Facilities web sites (not Workrequests)
Primavera
RMS
SCS-Mon (Nagios for HPCS systems)
Sophos (Anti-virus Updates)
UCB Library proxy
WebSnap
Webspace
Windows File Sharing
Windows Printing
60-net VM Hosting Service
Google continually enhances the products they provide to customers. We want to bring some of these to your attention and also give everyone a heads-up on recent efforts by IT's Google Support Team.
We would also like to encourage anyone with a special interest in Google, to join the LBL Google Users Group (primarily a mailing list which we use to provide advance notice of new features, request feedback, and follow community discussions). Join the group by going here.
Local Resources
A "New Employee Intro to Google" page was added. We have this linked under N (New employee ...) and G (Google ...) in the A-Z index and will be sending the link to each person who requests a new Google account. (This is linked off our main Google Help Center)
We are starting to explore Google Apps Scripting as a way to enhance our use of the product. A space on the Commons wiki was set up for anyone interested in writing scripts (or using ones others have written). For example, we have a method for users to forward a batch of email to someone else (after first labeling the messages of interest). This is a great solution for someone leaving the lab who wants to transfer job related emails to the person who is taking over responsibility for the position.
Google+
We have added Google+ (a social networking service) to the list of applications available to Lab Users. There is no "enterprise version" of Google+, so there are no boundary conditions (you are not restricted to seeing just LBL users or posting new content inside the Lab). One feature that we think is very useful is Hangouts. Hangouts provide a multi-person video conferencing capability. Recently, the ability to schedule an event with others was implemented - and these events will show up on your Google Calendar (once you accept an invitation that arrives in Gmail). Access to Google+ requires a registration effort and acceptance of terms and conditions. You will have to provide a birth date as part of this process. Google is not allowed to provide access to anyone under 13. If that situation is detected, the account is immediately disabled and you will not have access to any Google product, including email and calendar! . Be Careful !!!
Google Drive
Google Drive (was called Google Docs) has been out for several months. The changes were twofold: A new look for the Web user interface and the introduction of a desktop sync client for Macs and PCs. (Note - we are still in the "opt-in" stage where you can use the old "classic" look as well as the new look).
Google Drive's new desktop sync client continues to be a work in progress. We are closely following the Google Drive forums while we test the use of this "Dropbox" alternative at the Lab. We think this will eventually be a great addition - cloud based storage with sync to any number of workstations - but we think it is still a Beta Product. Try it with test files, but use it with caution.
The key issues (as reported by users worldwide) include excessive use of CPU resources, problems with XP service pack 3 systems (explorer crashes on some systems), the requirement to continually re-sync the contents of the workstation folder (even though only a few files have been changed), and some design issues that make it too easy to take a file or folder that has been shared with you and remove it from the original folder hierarchy established by the owner. We have also heard reports of lost data. We have no idea how often these issues surface, but since they are being reported, it is wise to go slow with adoption.
The core team responsible for our multi-year initiative to improve the energy efficiency of our research and operational computing datacenter has been recognized with two awards in one month. The team was recognized with a Director's Achievement Award and a Larry Sautter Award from the University of California. Congratulations to the team! The Pandas thank you.
Summary: Through a unique collaboration between Berkeley Lab’s energy efficiency researchers and IT Division, the team undertook a number of experimental and cutting edge approaches to improving legacy data center energy efficiency. These measures included one of the earliest implementations of a complete wireless sensor network to monitor the impact of the changes, extensive changes to the facilities infrastructure in the room, testing of early device prototypes with industrial partners, virtualization and consolidation, testing of modified controllable CRAC units, and many more. In November 2010, the team achieved an important milestone - a view of realtime power utilization effectiveness in the datacenter.
Project Description:
The team came together out of the combination of EETD’s expertise in energy efficiency in datacenters and IT’s pressing need to expand scientific computing resources in its datacenter to meet increasing demand. The goal of the project was to simultaneously explore and validate solutions for EETD’s research and to use these solutions to improve operational efficiency in the data center thereby allowing an increase the computational capability.
While the estimated PUE (Total energy use divided by the IT equipment energy use) of the datacenter suggested that it was relatively efficient in comparison to others that the EETD team benchmarked, the team believed that significant improvements were possible. The team initially developed a computational fluid dynamics (CFD) model of airflow in the datacenter. The data from this model confirmed the conclusion that airflow mixing in the datacenter contributed to its inefficiency. This suggested the need for a monitoring system that would allow the team to fully visualize and understand the scope of the problem. This enabled immediate feedback on the impact of various changes to the datacenter as they were implemented. The team engaged Synapsense, which at the time was just beginning development of its real-time, wireless, monitoring application, to deploy a system which would permit detailed analysis of the environmental conditions (humidity and temperature) along with air pressure and power monitoring at hundreds of points within the datacenter. The team worked with Synapsense to improve their product based on their experience within the datacenter. This work was conducted in phases over several years and is continuing to explore new efficiency opportunities.
Once the system was deployed, the team used the data to begin to change the airflow and make other operational adjustments in the datacenter. The team undertook a variety of fixes, some small, and some large:
Floor tile tuning to improve air pressure
Hot Aisle/Cold Aisle Isolation
Conversion of the overhead plenum to hot air return
Extension of CRAC returns to connect to overhead
Installation of curtains to further reduce hot aisle/cold aisle mixing
Installation of water cooled doors based on non-chilled water (collaboration with the vendor to reduce energy use)
Piloting of fully enclosed racks
Use of higher ambient temperature setpoints to improve efficiency
Throughout the process, the team collaborated with industrial partners to pilot new technology while influencing the technology roadmap for these products in the marketplace. This trend continues today with testing of a prototype APC in-row cooler and another project that may be the first ever computer controlled air conditioner fan and compressor control system which can dynamically adjust the Computer Room Air Conditioning cooling power depending on the conditions in the data center.
The culmination of this initial work occurred in November 2010, when LBL became one of the first organizations in the federal space, and among a handful of smaller data centers in the world, to be able to calculate and view the data center’s Power Utilization Effectiveness (PUE) in real-time. This critical metric, which indicates the power used by the infrastructure in the data center in comparison to the power used by the computers themselves, helps staff manage the data center on a dynamic basis to best achieve environmental goals. One vendor partner visited in November 2010 to present awards for the role LBL staff played in this achievement and in the roadmap for their product (http://today.lbl.gov/2010/11/12/berkeley-lab-data-center-at-cutting-edge-of-efficiency/).
In addition to the extensive collaboration between IT’s facilities experts and the researchers, the High Performance Computing, Infrastructure, and Collaboration teams also helped to support these goals. During this time, IT consolidated and virtualized its business systems, further reducing the impact on energy and floorspace in the datacenter. In addition, the move to cloud-based systems for email and collaborative applications also increased resiliency while reducing the impact on the datacenter. Finally, the HPC group continues to work with researchers to support demand-response testing, allowing for shedding load from scientific computing during times of reduced energy availability or in response to data center and environmental conditions.
By any measure, the impact of this achievement has been felt far beyond LBL’s data center. Numerous publications and reports have been generated from the work, as well as kudos for LBL’s efforts from around the world.
In the datacenter itself, LBL went from a situation where new datacenter construction was going to be needed imminently, to one in which we have headroom to continue to add scientific computing. Indeed, the room, which we believed to be at capacity in 2007, is currently running 50% more scientific computing yet has improved its efficiency (PUE) from 1.6 to 1.4 over that time. The room still has space to grow, as we continue to make use of cutting edge energy efficient cooling technologies to improve the room’s performance.
One good indicator of the quality of this achievement is the extent to which this achievement has been studied by others. Dozens of individuals and groups from industry, academia, and government have toured our datacenter as a model for how to green datacenters that weren’t built with modern efficiency standards in mind. While Google, Yahoo, and Facebook’s efforts get most of the industry’s attention, most companies, agencies, and universities have one or more legacy datacenters to deal with and no resources to build a new one from scratch.
Overall, this project represents a rare confluence of achievements: it simultaneously enabled new research and demonstration projects in a scientific division related directly to data center efficiency, enabled science in virtually every other scientific area of the laboratory by allowing for significant expansion of scientific computing resources, and reduced operational costs by allowing for continued and expanded capacity in a resource that was believed to be exhausted. In bringing together an operational need with scientific research, the Laboratory has shown by example how energy can be saved in older data centers, and has demonstrated how a continuous improvement process can lead to on-going energy savings.
It's time to say goodby to MyBLIS - the portal that is now used by around 140 customers at the lab. It is based on outdated and unsupported technology and a number of the features that made it attractive when it was introduced are no longer working.
It did offer some features that might be missed - but we have some suggestions for most of them:
- Bookmarks
- Common links for Lab services
- Work Queues
- Single Sign on
Bookmarks
Bookmarks are an important component of any browser experience. They provide an easy way to get back to a web site of interest. However, bookmarks are traditionally stored in a file on your computer - use another computer and you can't access them. myblis had the capability of storing bookmarks on a Lab server. There are a number of alternatives that can be considered.
Both Firefox and Chrome browsers provide alternatives.
- Firefox Sync - "Take your bookmarks, tabs and personal information with you"
- With Chrome's sign-in feature, "you no longer need to fret about your bookmarks or apps being "stuck" on one computer."
Another option is to use Google bookmarks.
We also want to note that Firefox and Safari both have interesting new features when you open a new tab - images of the web sites you last visited appear - and can be used to quickly go back to one of them.
Common Links for Lab services
The A-Z index on the labs home page remains as one of the best places to locate a link to a service you need. Over time this is likely to be supplemented with a web page that provides some of the same categories and links available through myblis. In the meantime, use this page.
Work Queues
One of the nice features in myblis (while it was working) concerned work queues. If you missed an email relating to approval of a procurement action or approval for employees LETs time was still pending, the work queue feature made it easy to catch up. We do not have an alternative to this feature.
Single Sign On
When myblis was first developed, it was thought we would integrate a single sign on capability along with it. For various reasons, it did not survive as our solution. Since then, we have implemented it with a new technology - those of you who access any of the Google Applications, Taleo, and the commons wiki's already take advantage of it - with many more applications planned in the next year.
As you (hopefully) know, IT Division is a big proponent of the importance of researchers choosing the productivity tools they feel most comfortable with. We've actually fought pretty hard against some folks to try to convince them what we think is true: the benefits of standardization are meager, and are far outweighed by the productivity gains of letting our community make informed choices about the tools they want and how to allocate their resources. So, it's time for our irregular check in on laptop trends.
Why Laptops: Because our data on desktops isn't as easy to parse. Desktops get used for a lot of different things (attached to scientific equipment, lab data collectors, parts of experiments, etc). Laptops, we think, are generally a better proxy to understand what end users are using as their go to computer platform.
Chart 1: Count of Laptops Currently in Use (in property database) in Scientific Divisions by Year of Purchase
|
|
|
|
Apple |
Windows/Linux |
2006 |
120 |
165 |
2007 |
167 |
226 |
2008 |
278 |
265 |
2009 |
302 |
304 |
2010 |
365 |
360 |
2011 |
380 |
305 |
2012 |
104 |
96 |
Chart 2: Count of Laptops Currently in Use (in property database) in All Divisions by Year of Purchase
|
|
|
|
Apple |
Windows/Linux |
2006 |
175 |
282 |
2007 |
200 |
328 |
2008 |
334 |
358 |
2009 |
357 |
446 |
2010 |
397 |
485 |
2011 |
449 |
463 |
2012 |
122 |
110 |
Chart 3: Laptops in Use (in property database) by Division 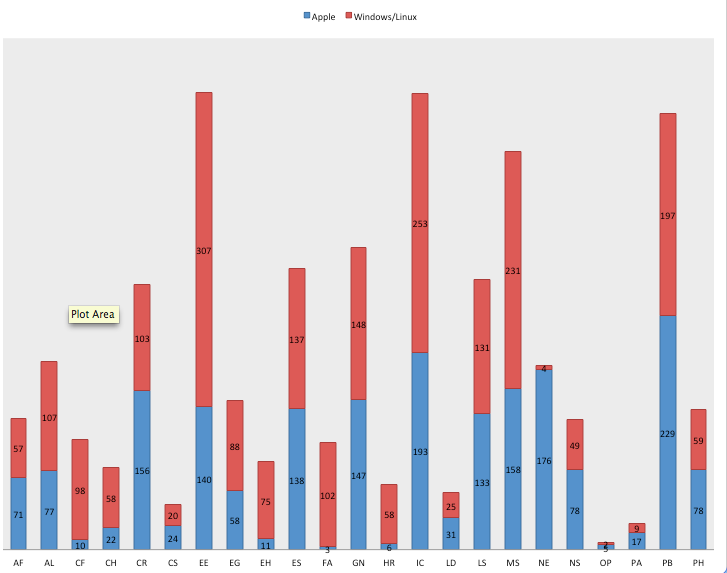
Chart 4: Laptops in Use by Division - Just for 2011-2012 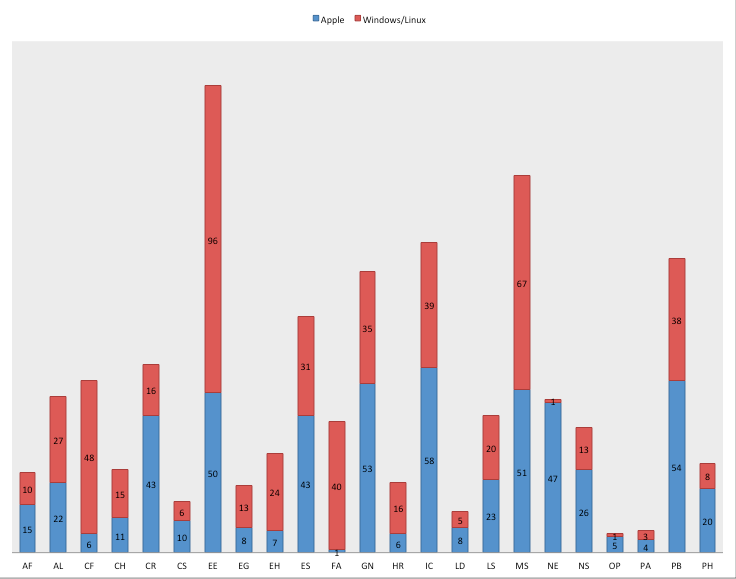
Conclusion: We remain nicely heterogenous. The trend towards OSX in the laptop space is decelerating, but continuing. All but one scientific division remain decidedly mixed in their platform choices.
Most computers at LBL are bought in the last three months of the year, so the numbers for FY12 are not yet representative. We'll recap at the end of the FY.